> ## Documentation Index
> Fetch the complete documentation index at: https://docs.lintkit.com/llms.txt
> Use this file to discover all available pages before exploring further.
# Export reports
> Export scan results as JSON, CSV, or HTML to share with your team or feed into CI pipelines
Pro feature. See [pricing](/features/pricing).
Export reports let you take LintKit's scan results out of the plugin and into your workflow. After scanning a file, you can export findings in three formats, each designed for a different use case.
 The compliance dashboard is free in both tiers. You only need Pro to export the data as a file. See the [compliance dashboard](/features/dashboard) for details on scoring and handoff status.
## How to export a report
Run a scan from the **Overview** tab. Wait for the scan to complete.
Click the **Export** button in the dashboard area. If you are on the free tier, you will see a prompt to upgrade.
Select **JSON**, **CSV**, or **HTML** depending on your use case (see below).
LintKit generates the report and triggers a download. The file name includes the scan date for easy tracking.
## Choosing a format
**Best for:** Automation, CI pipeline integration, tracking trends over time.
The JSON export includes the full structured data for every finding: rule ID, severity, affected node IDs, cluster key, and suggestion details. Use this format when you want to:
* Feed results into a CI/CD pipeline that checks design compliance before merging
* Build custom dashboards that track compliance scores across files over time
* Write scripts that parse findings and create tasks in your project management tool
The JSON also includes the overall compliance score, rating, and handoff status from the dashboard.
**Best for:** Spreadsheet reviews, team discussions, sorting and filtering findings.
The CSV export has one row per finding with columns for rule name, severity, summary, node count, and suggested action. Use this format when you want to:
* Import into Google Sheets or Excel for collaborative review
* Sort findings by severity or rule type to prioritize work
* Share a filtered list with specific team members (for example, all component findings for the component library owner)
Suggested actions are converted to human-readable descriptions like "Map to PAINT style 'brand/primary'" or "Snap corner radius to 8px."
**Best for:** Sharing with stakeholders, embedding in documentation, design reviews.
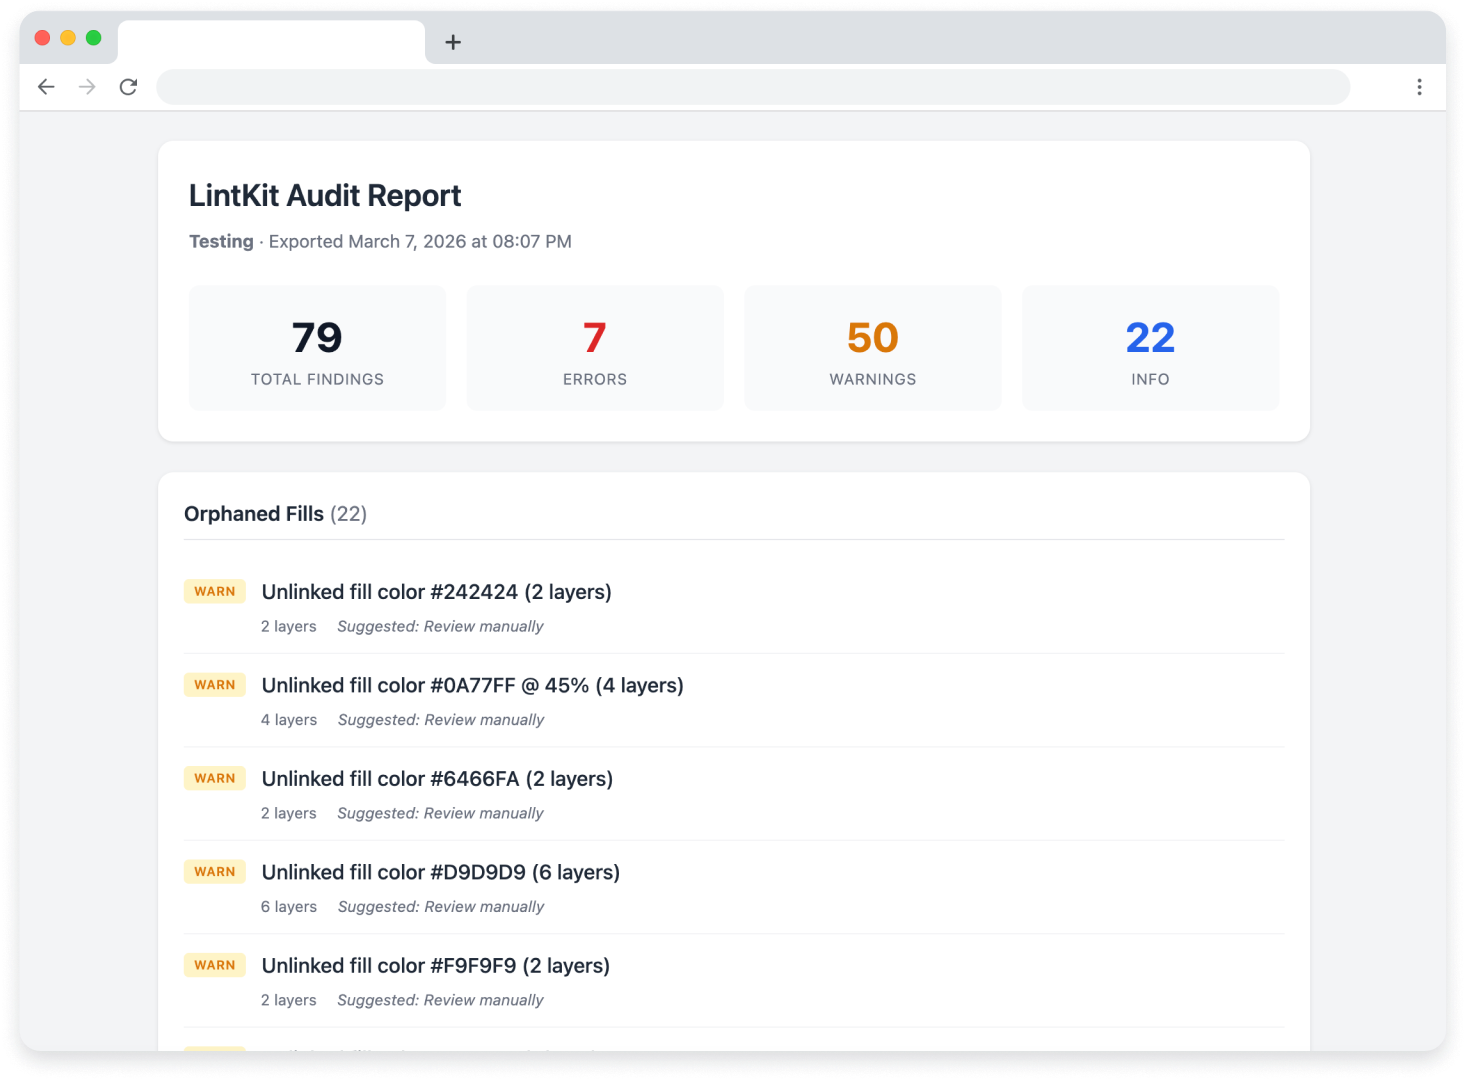
The HTML export is a self-contained compliance report that anyone can open in a browser. It includes:
* Overall compliance score and rating
* Findings grouped by category and severity
* Summary statistics
Use this format when you need to share results with people who do not have access to the Figma plugin, such as project managers or clients reviewing handoff readiness.
## What every report includes
Regardless of format, each exported report contains:
* **Findings list** -- every finding from the scan, including rule name, severity, summary, and affected node count
* **Suggested fixes** -- the recommended action for each finding, converted to readable text
* **Compliance score** -- the same score shown in the dashboard, calculated as `((totalNodes - totalFindings) / totalNodes) x 100`
* **Compliance rating** -- Excellent, Good, Needs work, or Critical
* **Handoff status** -- Ready, Needs review, or Needs attention
* **Severity breakdown** -- counts of errors, warnings, and info-level findings
## Compliance dashboard vs export reports
| Capability | Free | Pro |
| -------------------------------- | ---- | --- |
| Compliance score after each scan | Yes | Yes |
| Handoff status badge | Yes | Yes |
| Severity breakdown | Yes | Yes |
| Estimated fix time | Yes | Yes |
| Export as JSON | -- | Yes |
| Export as CSV | -- | Yes |
| Export as HTML | -- | Yes |
The compliance dashboard is free in both tiers. You only need Pro to export the data as a file. See the [compliance dashboard](/features/dashboard) for details on scoring and handoff status.
## How to export a report
Run a scan from the **Overview** tab. Wait for the scan to complete.
Click the **Export** button in the dashboard area. If you are on the free tier, you will see a prompt to upgrade.
Select **JSON**, **CSV**, or **HTML** depending on your use case (see below).
LintKit generates the report and triggers a download. The file name includes the scan date for easy tracking.
## Choosing a format
**Best for:** Automation, CI pipeline integration, tracking trends over time.
The JSON export includes the full structured data for every finding: rule ID, severity, affected node IDs, cluster key, and suggestion details. Use this format when you want to:
* Feed results into a CI/CD pipeline that checks design compliance before merging
* Build custom dashboards that track compliance scores across files over time
* Write scripts that parse findings and create tasks in your project management tool
The JSON also includes the overall compliance score, rating, and handoff status from the dashboard.
**Best for:** Spreadsheet reviews, team discussions, sorting and filtering findings.
The CSV export has one row per finding with columns for rule name, severity, summary, node count, and suggested action. Use this format when you want to:
* Import into Google Sheets or Excel for collaborative review
* Sort findings by severity or rule type to prioritize work
* Share a filtered list with specific team members (for example, all component findings for the component library owner)
Suggested actions are converted to human-readable descriptions like "Map to PAINT style 'brand/primary'" or "Snap corner radius to 8px."
**Best for:** Sharing with stakeholders, embedding in documentation, design reviews.
The HTML export is a self-contained compliance report that anyone can open in a browser. It includes:
* Overall compliance score and rating
* Findings grouped by category and severity
* Summary statistics
Use this format when you need to share results with people who do not have access to the Figma plugin, such as project managers or clients reviewing handoff readiness.
## What every report includes
Regardless of format, each exported report contains:
* **Findings list** -- every finding from the scan, including rule name, severity, summary, and affected node count
* **Suggested fixes** -- the recommended action for each finding, converted to readable text
* **Compliance score** -- the same score shown in the dashboard, calculated as `((totalNodes - totalFindings) / totalNodes) x 100`
* **Compliance rating** -- Excellent, Good, Needs work, or Critical
* **Handoff status** -- Ready, Needs review, or Needs attention
* **Severity breakdown** -- counts of errors, warnings, and info-level findings
## Compliance dashboard vs export reports
| Capability | Free | Pro |
| -------------------------------- | ---- | --- |
| Compliance score after each scan | Yes | Yes |
| Handoff status badge | Yes | Yes |
| Severity breakdown | Yes | Yes |
| Estimated fix time | Yes | Yes |
| Export as JSON | -- | Yes |
| Export as CSV | -- | Yes |
| Export as HTML | -- | Yes |