> ## Documentation Index
> Fetch the complete documentation index at: https://docs.lintkit.com/llms.txt
> Use this file to discover all available pages before exploring further.
# Compliance dashboard
> Understand your file health score and know when your design is ready for handoff
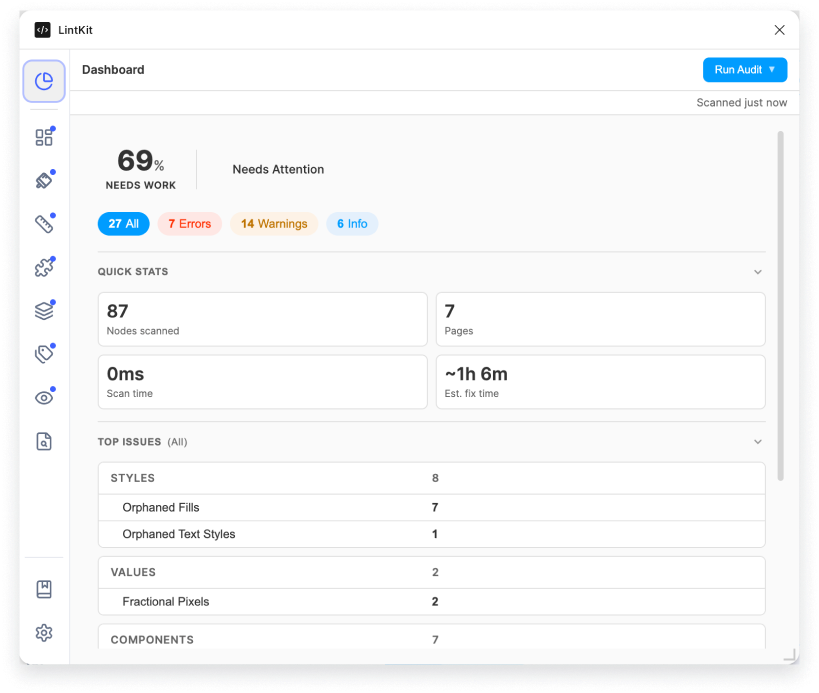
The compliance dashboard gives you a single number that answers: "How clean is this file?" It appears at the top of the **Overview** tab after every scan and is free in both tiers.
 ## How the score works
The compliance score measures the percentage of nodes in your file that have no findings:
```
((totalNodes - totalFindings) / totalNodes) x 100
```
The result is rounded to one decimal place and clamped between 0 and 100. A file with zero nodes scores 100 by default.
### Worked example
Suppose you scan a file and LintKit reports:
| Metric | Value |
| ------------------- | ------ |
| Total nodes scanned | 1,200 |
| Errors | 4 |
| Warnings | 38 |
| Info | 18 |
| **Total findings** | **60** |
The compliance score is:
```
((1,200 - 60) / 1,200) x 100 = 95.0%
```
That file earns an **Excellent** rating. The estimated fix time would be:
```
(4 x 5 min) + (38 x 2 min) + (18 x 0.5 min) = 20 + 76 + 9 = 105 minutes
```
## Rating thresholds
| Score | Rating | What it means |
| ----------- | ---------- | -------------------------------------------------------------------- |
| 95 or above | Excellent | File is clean. Minor polish at most. |
| 80 to 94 | Good | Solid shape, but worth a pass before handoff. |
| 50 to 79 | Needs work | Significant inconsistencies. Prioritize errors first, then warnings. |
| Below 50 | Critical | Major cleanup needed. Consider a focused session with Bulk Fix. |
## Handoff status
The handoff status tells you whether a file is safe to hand to developers. It considers only errors and warnings because info-level findings are cosmetic.
| Condition | Status |
| -------------------------------- | --------------- |
| No errors, fewer than 3 warnings | Ready |
| No errors, 3 or more warnings | Needs review |
| Any errors present | Needs attention |
## What to do with each rating
Skim the remaining findings. Most are likely info-level. Fix any that affect handoff clarity, then ship.
Filter findings by **error** severity first and resolve those. Then work through warnings. You can usually reach Excellent in one session.
Sort by severity. Fix all errors first since they block handoff. Use the category tabs (**Styles**, **Values**, **Components**) to batch similar findings. If you have Pro, **Bulk Fix** can handle groups of orphaned styles or fractional pixels quickly.
Start with the highest-count findings on the **Overview** tab. Orphaned fills and orphaned text are usually the biggest contributors. Address the top 3-4 finding types and rescan. You should see a significant score jump after each pass.
## Estimated fix time
LintKit estimates how long it will take to resolve all findings based on severity:
| Severity | Estimated time per finding |
| -------- | -------------------------- |
| Error | \~5 minutes |
| Warning | \~2 minutes |
| Info | \~30 seconds |
The formula is:
```
Math.ceil(errors x 5 + warnings x 2 + infos x 0.5) minutes
```
These estimates assume manual, one-at-a-time fixes. With Pro's Bulk Fix, the actual time can be significantly lower.
## Quick stats
After each scan, the dashboard displays:
* Total nodes scanned
* Total findings
* Breakdown by severity (error, warning, info)
* Estimated fix time
* Handoff status badge
The compliance dashboard is free in both tiers. If you want to share the score and findings with your team, the Pro tier lets you export reports in JSON, CSV, or HTML. See [Export reports](/features/reports).
## How the score works
The compliance score measures the percentage of nodes in your file that have no findings:
```
((totalNodes - totalFindings) / totalNodes) x 100
```
The result is rounded to one decimal place and clamped between 0 and 100. A file with zero nodes scores 100 by default.
### Worked example
Suppose you scan a file and LintKit reports:
| Metric | Value |
| ------------------- | ------ |
| Total nodes scanned | 1,200 |
| Errors | 4 |
| Warnings | 38 |
| Info | 18 |
| **Total findings** | **60** |
The compliance score is:
```
((1,200 - 60) / 1,200) x 100 = 95.0%
```
That file earns an **Excellent** rating. The estimated fix time would be:
```
(4 x 5 min) + (38 x 2 min) + (18 x 0.5 min) = 20 + 76 + 9 = 105 minutes
```
## Rating thresholds
| Score | Rating | What it means |
| ----------- | ---------- | -------------------------------------------------------------------- |
| 95 or above | Excellent | File is clean. Minor polish at most. |
| 80 to 94 | Good | Solid shape, but worth a pass before handoff. |
| 50 to 79 | Needs work | Significant inconsistencies. Prioritize errors first, then warnings. |
| Below 50 | Critical | Major cleanup needed. Consider a focused session with Bulk Fix. |
## Handoff status
The handoff status tells you whether a file is safe to hand to developers. It considers only errors and warnings because info-level findings are cosmetic.
| Condition | Status |
| -------------------------------- | --------------- |
| No errors, fewer than 3 warnings | Ready |
| No errors, 3 or more warnings | Needs review |
| Any errors present | Needs attention |
## What to do with each rating
Skim the remaining findings. Most are likely info-level. Fix any that affect handoff clarity, then ship.
Filter findings by **error** severity first and resolve those. Then work through warnings. You can usually reach Excellent in one session.
Sort by severity. Fix all errors first since they block handoff. Use the category tabs (**Styles**, **Values**, **Components**) to batch similar findings. If you have Pro, **Bulk Fix** can handle groups of orphaned styles or fractional pixels quickly.
Start with the highest-count findings on the **Overview** tab. Orphaned fills and orphaned text are usually the biggest contributors. Address the top 3-4 finding types and rescan. You should see a significant score jump after each pass.
## Estimated fix time
LintKit estimates how long it will take to resolve all findings based on severity:
| Severity | Estimated time per finding |
| -------- | -------------------------- |
| Error | \~5 minutes |
| Warning | \~2 minutes |
| Info | \~30 seconds |
The formula is:
```
Math.ceil(errors x 5 + warnings x 2 + infos x 0.5) minutes
```
These estimates assume manual, one-at-a-time fixes. With Pro's Bulk Fix, the actual time can be significantly lower.
## Quick stats
After each scan, the dashboard displays:
* Total nodes scanned
* Total findings
* Breakdown by severity (error, warning, info)
* Estimated fix time
* Handoff status badge
The compliance dashboard is free in both tiers. If you want to share the score and findings with your team, the Pro tier lets you export reports in JSON, CSV, or HTML. See [Export reports](/features/reports).